
FROM THE ARCHIVE
The loss ratio is a basis, not a number
Why insurers need to understand the losses, premium, period and reinsurance behind every ratio—and how AegisNow connects that understanding to better decisions.

When an insurance leadership team sees a loss ratio of 58.5%, the immediate question is often whether the business is performing well. My first question is different: 58.5% of what, measured how, and at which date? A precise percentage can conceal an imprecise definition. Before we use it to price a product, assess a portfolio or settle with a reinsurer, we need to understand the basis behind it.
One book. Three answers. Different business decisions.
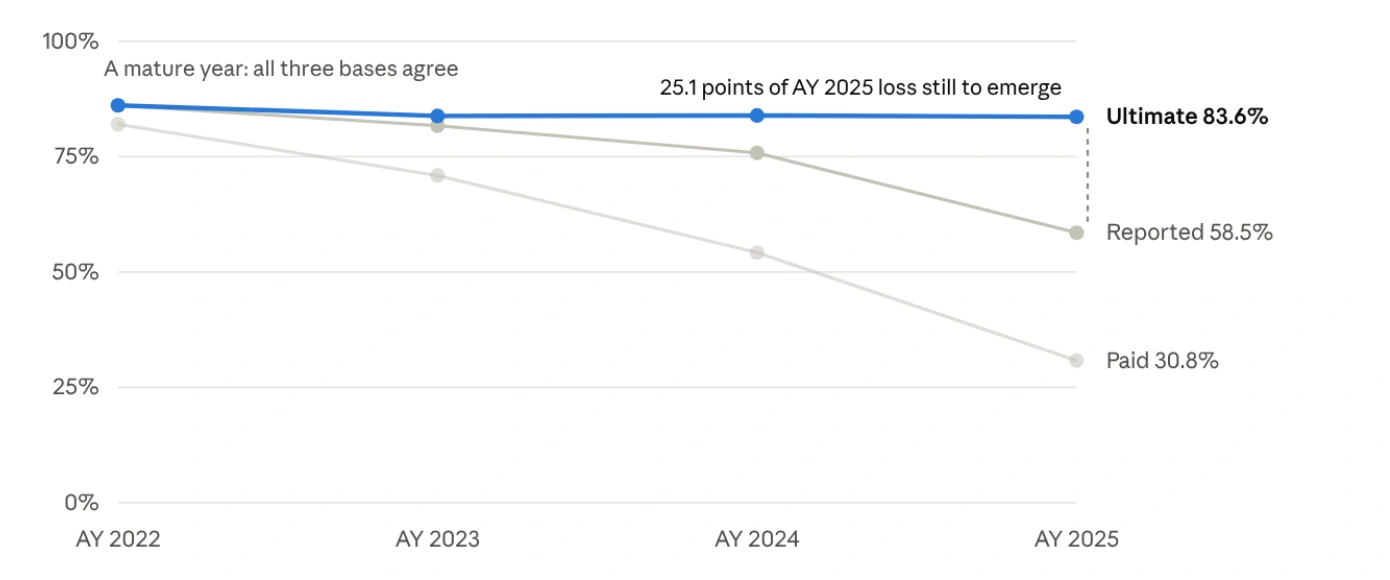
The illustrative example in our loss-ratio paper shows why this matters. For the youngest accident year, the paid loss ratio is 30.8%, the reported loss ratio is 58.5%, and the estimated ultimate loss ratio is 83.6%. These figures describe the same book on different loss bases. They are not three competing versions of the truth.
Paid losses reflect payments already made. Reported losses, in this example, combine paid amounts with case reserves on known claims. Estimated ultimate losses also reflect expected future development, including claims incurred but not yet reported and further development on known claims. The 25.1 percentage-point difference between reported and estimated ultimate changes the conversation about the book.
Crucially, 83.6% is an estimate, not a promise about the final outcome. An actuary must assess the method, assumptions and uncertainty. A low paid ratio on a young portfolio does not, by itself, demonstrate strong underwriting performance.
 View full-size graphic
Original graphic from the supplied paper; image labels remain in English.
Read the explanation and assumptions
The paper uses an illustrative portfolio with earned premium ranging from 1,000 to 1,300 and estimates ultimate losses using a volume-weighted chain-ladder method on reported losses. The chart is reproduced directly, preserving the original plotted values.
The 2025 reported-to-ultimate difference is 25.1 percentage points. Actual development may be higher or lower. This is an illustrative actuarial example, not a client outcome.
- Paid loss ratio
- 30.8%Payments already made
- Reported loss ratio
- 58.5%Paid losses plus case reserves
- Estimated ultimate loss ratio
- 83.6%Including expected future claim development
Reported to estimated ultimate: a 25.1 percentage-point gap. The ultimate estimate remains subject to uncertainty.
Make the definition travel with the number
I want a loss-ratio result to carry its essential context: the portfolio and period, valuation date, loss measure, claim-expense treatment, premium measure, and treatment of recoveries and reinsurance. An approved ultimate estimate should also identify its reserving run and accountable reviewer.
For example, “accident-year reported loss and allocated claim-expense ratio, on earned premium, net of reinsurance, valued at 31 December 2025” is substantially more useful than “loss ratio: 58.5%.” The underlying records should explain any additional treatment of salvage, subrogation and unallocated expenses.
This is a practical management control. Underwriting, finance, actuarial and reinsurance teams can use different views when their purposes differ. They should be able to reconcile those views without reconstructing the calculation from disconnected spreadsheets.
 View full-size graphic
Original graphic from the supplied paper; image labels remain in English.
Read the explanation and assumptions
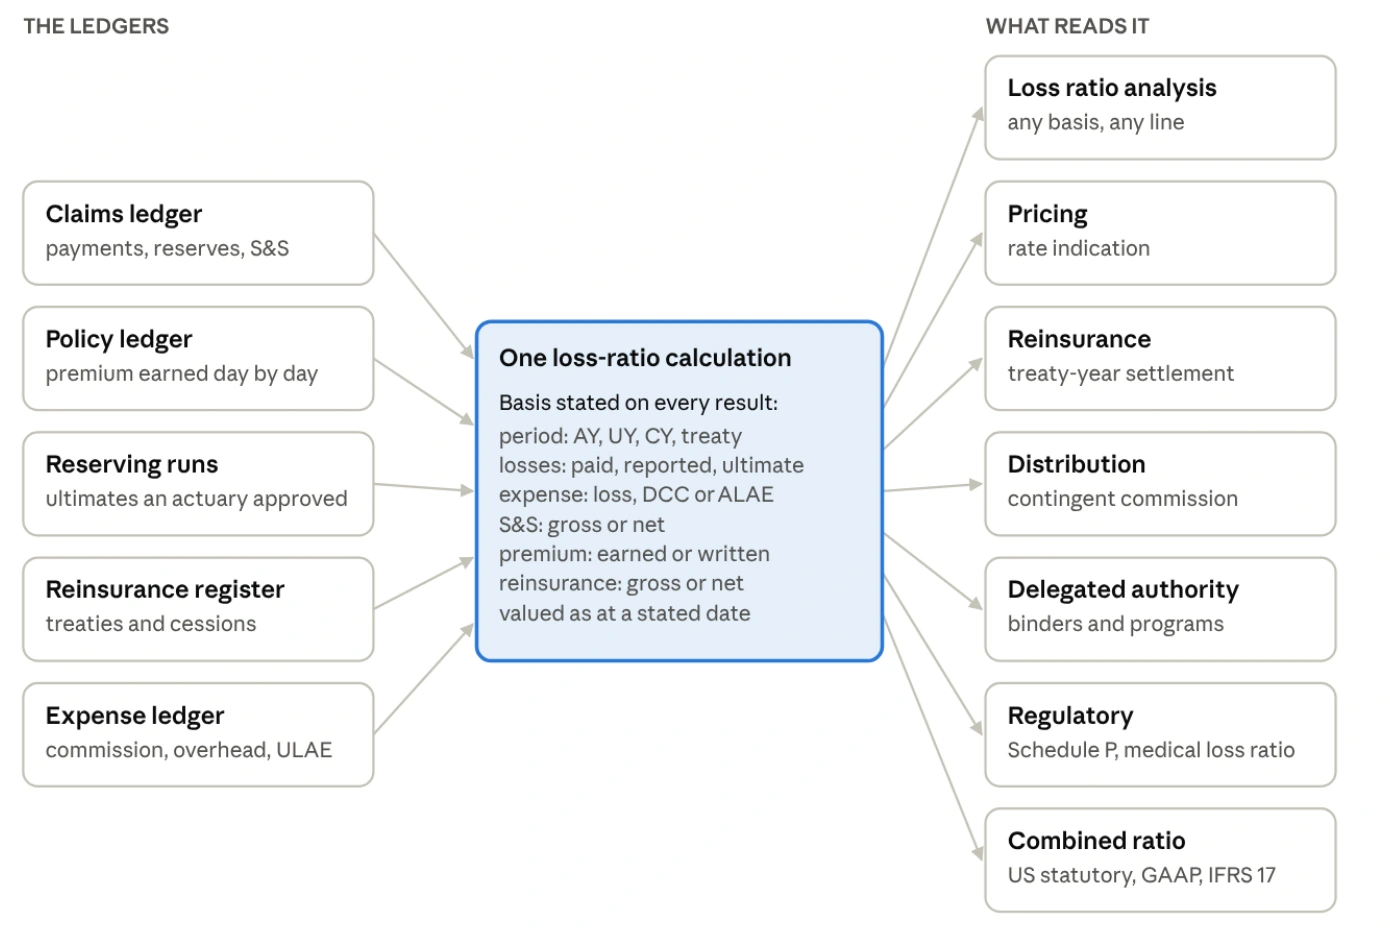
Inputs: claims payments and reserves; policy premium; approved reserving runs; treaties and cessions; and expense records. The calculation records the period, loss measure, expense treatment, recoveries, premium basis, reinsurance treatment and valuation date.
Outputs support loss-ratio analysis, pricing, reinsurance, distribution, delegated authority, regulatory reporting and combined-ratio analysis. A shared calculation foundation supports consistent definitions; each use still requires its own appropriate contractual, actuarial and accounting rules.
Three avoidable errors with material consequences
First, do not confuse portfolio growth with profitability. Written premium and earned premium answer different questions. Comparing losses with a rapidly growing written-premium denominator can produce a misleading performance signal. Select the denominator appropriate to the purpose and state it explicitly.
Second, aggregate the underlying amounts before dividing. In a simple example, a segment with premium of 100 and no losses has a 0% ratio. A second segment with premium of 1,000 and losses of 800 has an 80% ratio. The portfolio loss ratio is 800 divided by 1,100, or 72.7%—not the 40% obtained by averaging the two percentages. This example excludes expenses.
Third, keep clean business in the population and unresolved data visible. A segment with valid positive premium and no claims belongs in the analysis. A claim that cannot be matched to a policy belongs in an exception process, with its financial impact disclosed. Missing data is not the same as zero loss.
From historical experience to a responsible pricing decision
A historical loss ratio is a starting point for pricing, not a rate instruction. The CAS Basic Ratemaking text explains why prospective analysis considers loss development, trend, current premium rate levels, expenses and profit provisions. The actuary must select assumptions appropriate to the business.
Fixed and variable expenses should not be treated as interchangeable. Credibility also needs an explicit method and a defensible complement. A single claim-count threshold or an automatic assumption of “no change” is not a universal answer for every portfolio.
For leadership, the useful output is a recommendation with an explanation: what changed, which assumptions drive the result, how sensitive it is, and who has reviewed it. That makes challenge possible before a pricing decision reaches customers.
When the ratio moves money, the contract must control
A loss ratio may influence a sliding-scale commission, profit commission or aggregate protection. At that point, a definition error can become a settlement dispute. The treaty wording must determine the relevant premium, losses, expenses, periods, limits, development provisions and adjustment schedule.
Consider an illustrative treaty review. The team first identifies the covered business and contract period. It then reconciles subject premium and eligible losses, applies the agreed treatment of outstanding claims and other reinsurance, calculates the contractual adjustment, and obtains approval before settlement. Each step should retain supporting records.
An approved ultimate loss estimate does not automatically become the contractual settlement basis. Nor does every treaty use earned premium or the same treatment of IBNR. The actuarial view and the amount currently payable can differ for legitimate reasons; the system should explain the difference.
For delegated authority business, cumulative bordereaux require particular care. Adding successive cumulative snapshots can double-count amounts. The data model must distinguish a current position from movements during the period and reconcile corrections and exclusions before reporting.
Reconcile reporting views instead of assuming they are equivalent
US statutory reporting, US GAAP and IFRS 17 serve different reporting requirements. A reconciliation should identify changes in expense recognition, the revenue measure, discounting, risk adjustment and the treatment of reinsurance where relevant. A different ratio does not automatically mean a different economic outcome.
Under IFRS 17, insurance revenue excludes investment components and is presented separately from insurance finance income or expenses. It should not simply be relabelled “earned premium.” Combined-ratio comparisons also require the company’s metric definition and accounting policies; there is no single numerical conversion that fits every insurer.
The examples in this discussion principally concern P&C loss-ratio analysis. Life, annuity and health portfolios require measures suited to their products and reporting purposes. A P&C loss ratio should not be presented as a complete measure of life-insurance profitability or as the regulated medical loss ratio used for health-insurance rebates.
 View full-size graphic
Original graphic from the supplied paper; image labels remain in English.
Read the explanation and assumptions
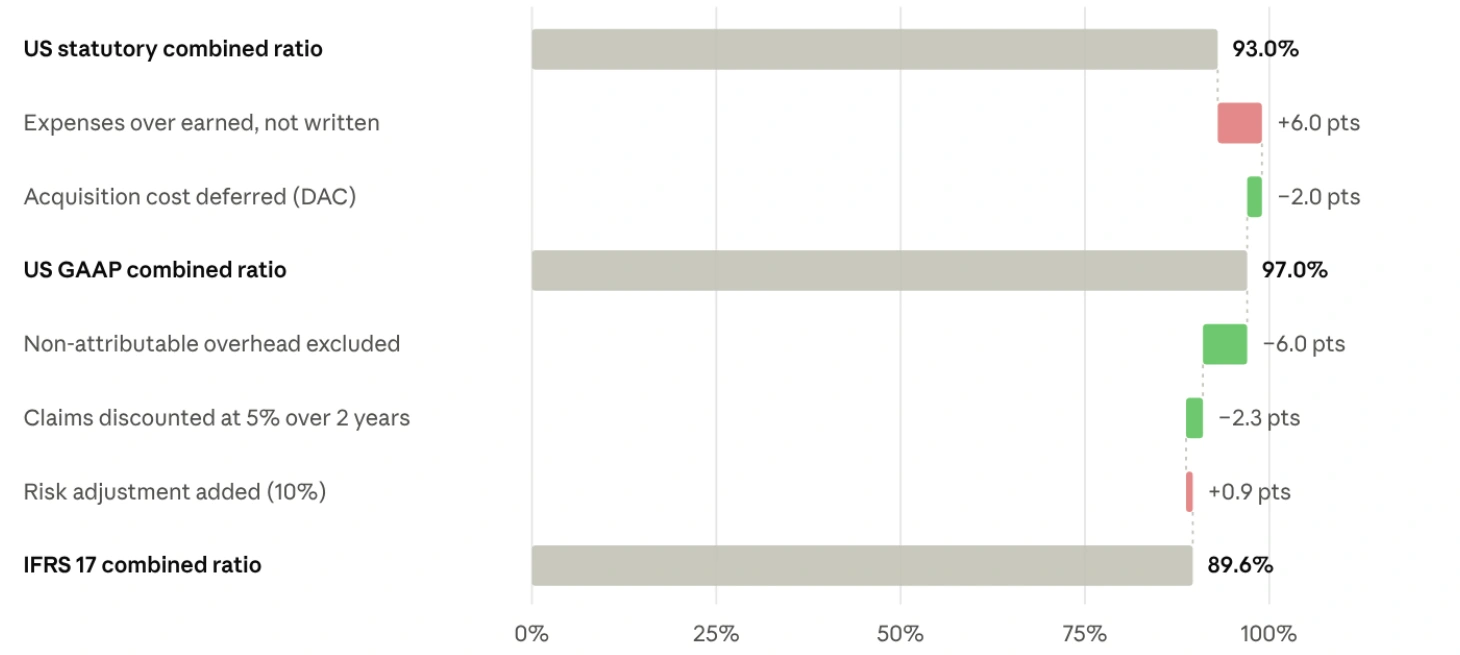
The example starts at 93.0%. Changing the expense denominator adds 6.0 percentage points; the assumed acquisition-cost adjustment subtracts 2.0, producing 97.0%. The remaining illustrated adjustments are −6.0 for non-attributable overhead, −2.3 for discounting and +0.9 for risk adjustment, producing 89.6%. Figures are rounded.
Source assumptions include earned premium of 1,000, written premium of 1,250, losses and allocated claim expenses of 650, unallocated claim expenses of 40, and specified acquisition and overhead costs. The graphic assumes a 5% discount rate over two years and a 10% risk adjustment.
For an actual reporting bridge, finance and actuarial teams must validate revenue recognition, expense allocation, liability movements, discounting, risk adjustment and the company’s ratio definition. IFRS 17 insurance revenue must not simply be treated as earned premium.
AI should make the evidence easier to examine
I see a valuable role for AI in finding mismatched records, highlighting unusual movements and preparing explanations for expert review. It can reduce the time spent searching for the reason two reports disagree. The benefit depends on access to consistent, traceable information.
The calculation itself should remain reproducible. A generated explanation is not a substitute for the underlying ledger, an approved actuarial assumption or a contractual interpretation. If required inputs are missing, the workflow should identify the gap rather than silently substitute a target ratio and present it as observed experience.
Actuaries retain responsibility for methods and assumptions; finance and reinsurance professionals retain their respective approval responsibilities. Effective automation gives those people better evidence and more time to exercise judgment.
How Genellipse helps turn a ratio into an accountable decision
Our AegisNow approach connects policy, claims, reserving, reinsurance and expense information around an explicit calculation basis. The objective is a shared, governed foundation for insurance decisions: consistent source records, clearly labelled views, controlled assumptions and a traceable path from a result to its supporting evidence.
We start with a partner’s actual problem—for example, a recurring difference between underwriting and finance reports, a slow treaty reconciliation or uncertainty about a young portfolio. Together, we agree the business definition, identify authoritative data and build a reference calculation that the responsible professionals can validate.
GeneData and our integration services can help connect existing administration and finance systems, map identifiers and expose data-quality exceptions. AegisNow provides the insurance workflow context. Cortex AI OS can support governed agent workflows for evidence preparation and exception investigation, with access controls and human approval boundaries defined for the implementation.
We then validate representative cases: a loss-free segment, a late-reported claim, a reserve revision, a policy crossing reporting periods and a treaty adjustment. Applicable accounting and contract requirements are agreed with the insurer’s specialists. Success is measured through reconciliation time, unexplained differences, manual rework and evidence completeness—not an unsupported promise to improve underwriting results.
This is partnership with accountability throughout delivery. Our role is to connect technology, data and professional expertise so that the organization can operate and sustain the capability with confidence.
FROM PERSPECTIVE TO PRACTICE
Explore AegisNow capabilitiesFive questions for the next portfolio review
1. What exactly is in the numerator and denominator, and how are the periods matched?
2. Is the result paid, reported or estimated ultimate—and what is the valuation date?
3. What expenses, recoveries, reinsurance and data exclusions explain the difference from other reports?
4. Can the team reproduce the result, identify the approved assumptions and explain its uncertainty?
5. Is this the correct basis for the decision we are about to make, including any contractual payment?
For me, the standard is straightforward: every important insurance number should come with enough context to support a responsible decision. That is how we move from a dashboard that looks precise to an organization that understands its risk.